Value Investors Should Buy Bonds - Here is how and why
The Federal Reserve is likely to shift to a more restrictive stance - this could rock the stock market. Bonds are the answer, and here is why and how to do it
The Federal Reserve had pushed interest rates upward for some time after ultra-low levels driven by the COVID shutdown. The reason the Fed shifted gears to a much tighter stance was inflation. The stock market felt that the Fed was done raising interest rates and the market took off north of improbable to hit all-time high levels in anticipation of an economy that would land softly despite the higher interest rates, and the Fed’s ultimate loosening of rates. The stock market got it wrong, and the Federal Reserve is not likely to loosen rates but, instead, tighten rates.
What does that mean for the stock market and a value investor?
The economy gets economic data this week and it may reiterate that the US economic engine is firing hard. But, it may also reiterate that inflation is too high to achieve the price levels the Fed is hoping to get to. Because of that, bonds may sell along with the equity markets. That could be an opportunity for savvy investors looking to profit over a period of time.
Inflation
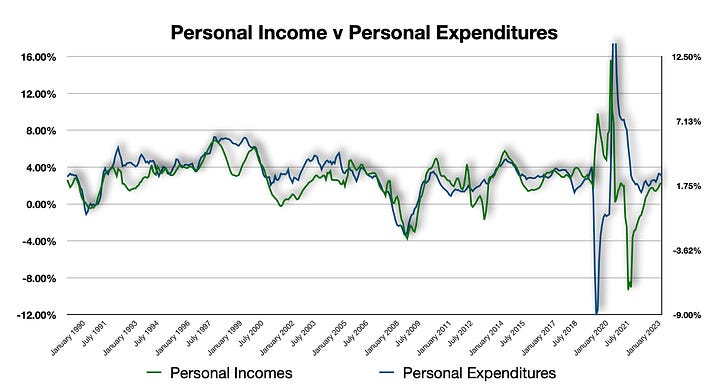
My analysis is always driven by the economy first, and foremost. No stock operates on an island and the stock market itself is a combination of all companies operating within an economy, driven by consumption and demand.
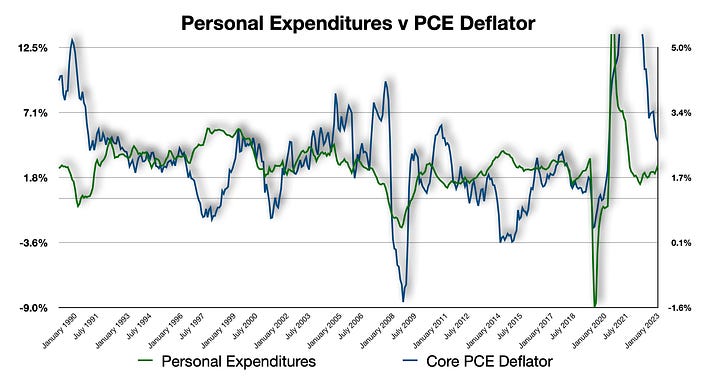
The first image above is Personal Incomes versus Personal Expenditures, then Personal Expenditures versus the all-too-crucial PCE Price Index. The charts above are year-over-year rates of change. As the rate of change of incomes either increases or decreases, so too does expenditures, as the charts show correlatively.
Personal incomes are an aggregate of total income earned by individuals in the US. If more people are added to the payrolls of companies, then incomes increase accordingly. At the same time, anyone already employed who may get a pay increase adds to the aggregate income levels. This drives growth rates within the economy.
Government & Business expenditures
While government expenditures do add to overall economic expenditures, the rate of growth is fairly flatline because government expenditures do not shift upward or downward very much.
Businesses also add to economic activity and would contribute to economy growth or decline. But, the drive from business expenditures via additions to inventories or capital investment is driven by demand. That comes mainly comes from consumers - as consumers account for such a large portion of overall aggregate demand.
Expenditures & Inflation
The second chart above is Personal Expenditures versus the Personal Consumption Expenditures (PCE) Price Deflator Index. Comparing prices of what consumers pay from a previous historical level, the Index ‘deflates’ these prices to show overall rises and declines from that given period over time. Again, the charts above are year-over-year advances.
As you can see, there are correlations to incomes versus consumption, and that correlation is fairly strong. Likewise, the correlation between consumption and price increases or decreases is there, but there is an overall decline compared to the correlation of incomes versus consumption.
Bullet Point Take on Incomes, Expenditures & Prices
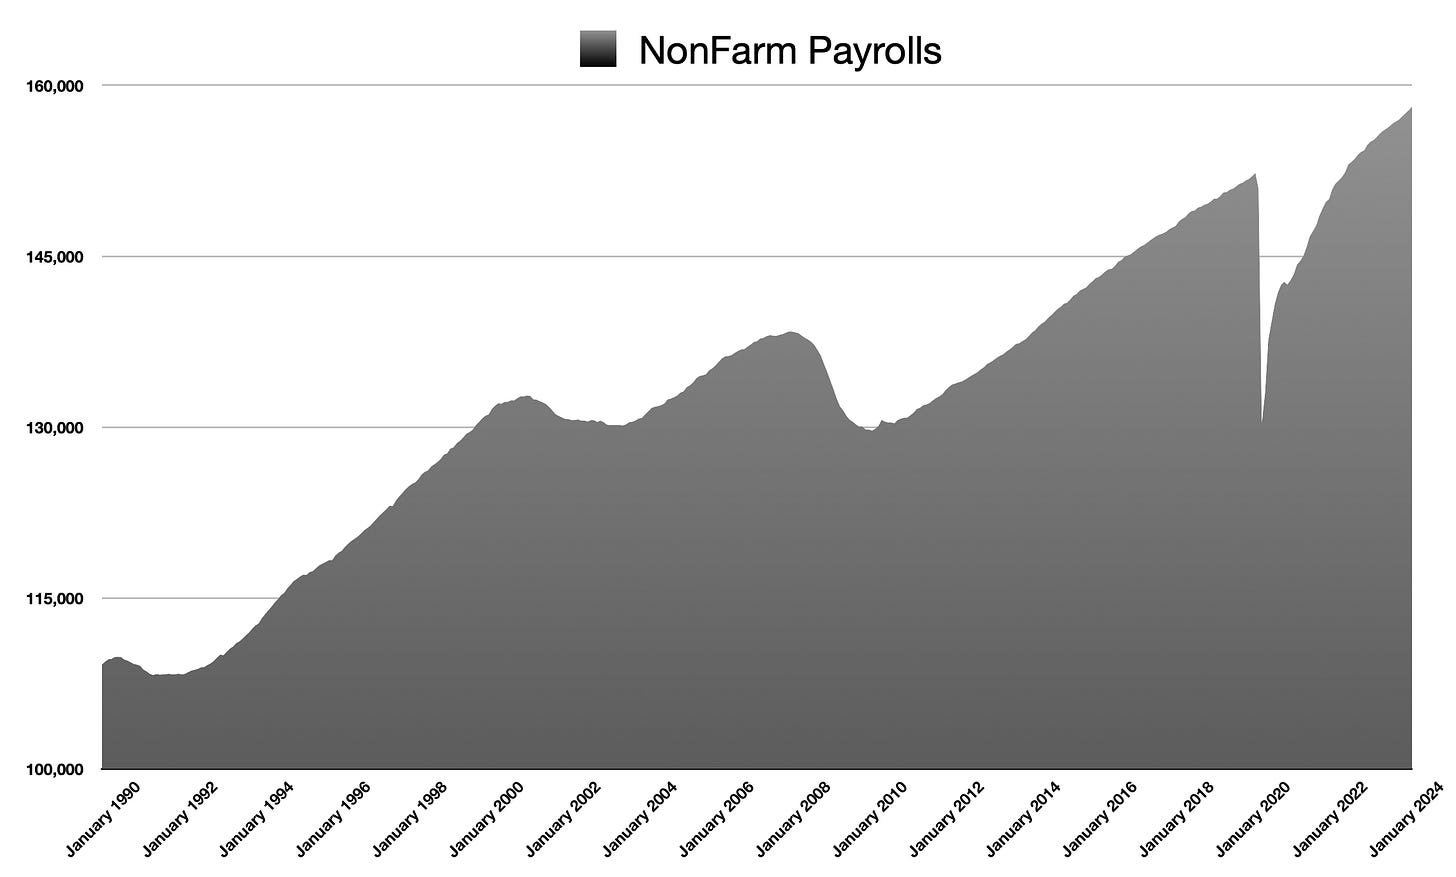
Looking above, the obvious starting point is incomes. The above chart shows that non-farm payrolls in the US are at all-time highs. More individuals are employed today than ever before.
Given that, looking at the rate of growth of incomes, yo can see that the year-over-year change is trending higher after dropping as hard as it did from COVID-related lockdowns - and the related economic contraction.
Expenditures are following in the footsteps of incomes. And, so are prices. Inflation numbers have come in hotter-than-expected over the past few months. This is normal as price pressures would follow expenditures.
However, at the same time, this is a purely clinical and classical approach. Looking further into price pressures, a lot of this is driven by housing. Still, the resulting pressures are there and likely to persist unless the Fed takes action.
The Bureau of Labor Statistics produces the CPI data and we get that about 2 weeks before the PCE index. As it is, the PCE index is the Fed’s favorite and preferred tool for measuring price pressures - likely, the do not even really look at CPI.
Nonetheless, the CPI and PCE are highly correlated. The CPI came in hotter than expected. Again. The PCE will very likely do the same. This has the potential to really rock the stock market because equity investors have been betting on three rate cuts this year.
The Stock Market
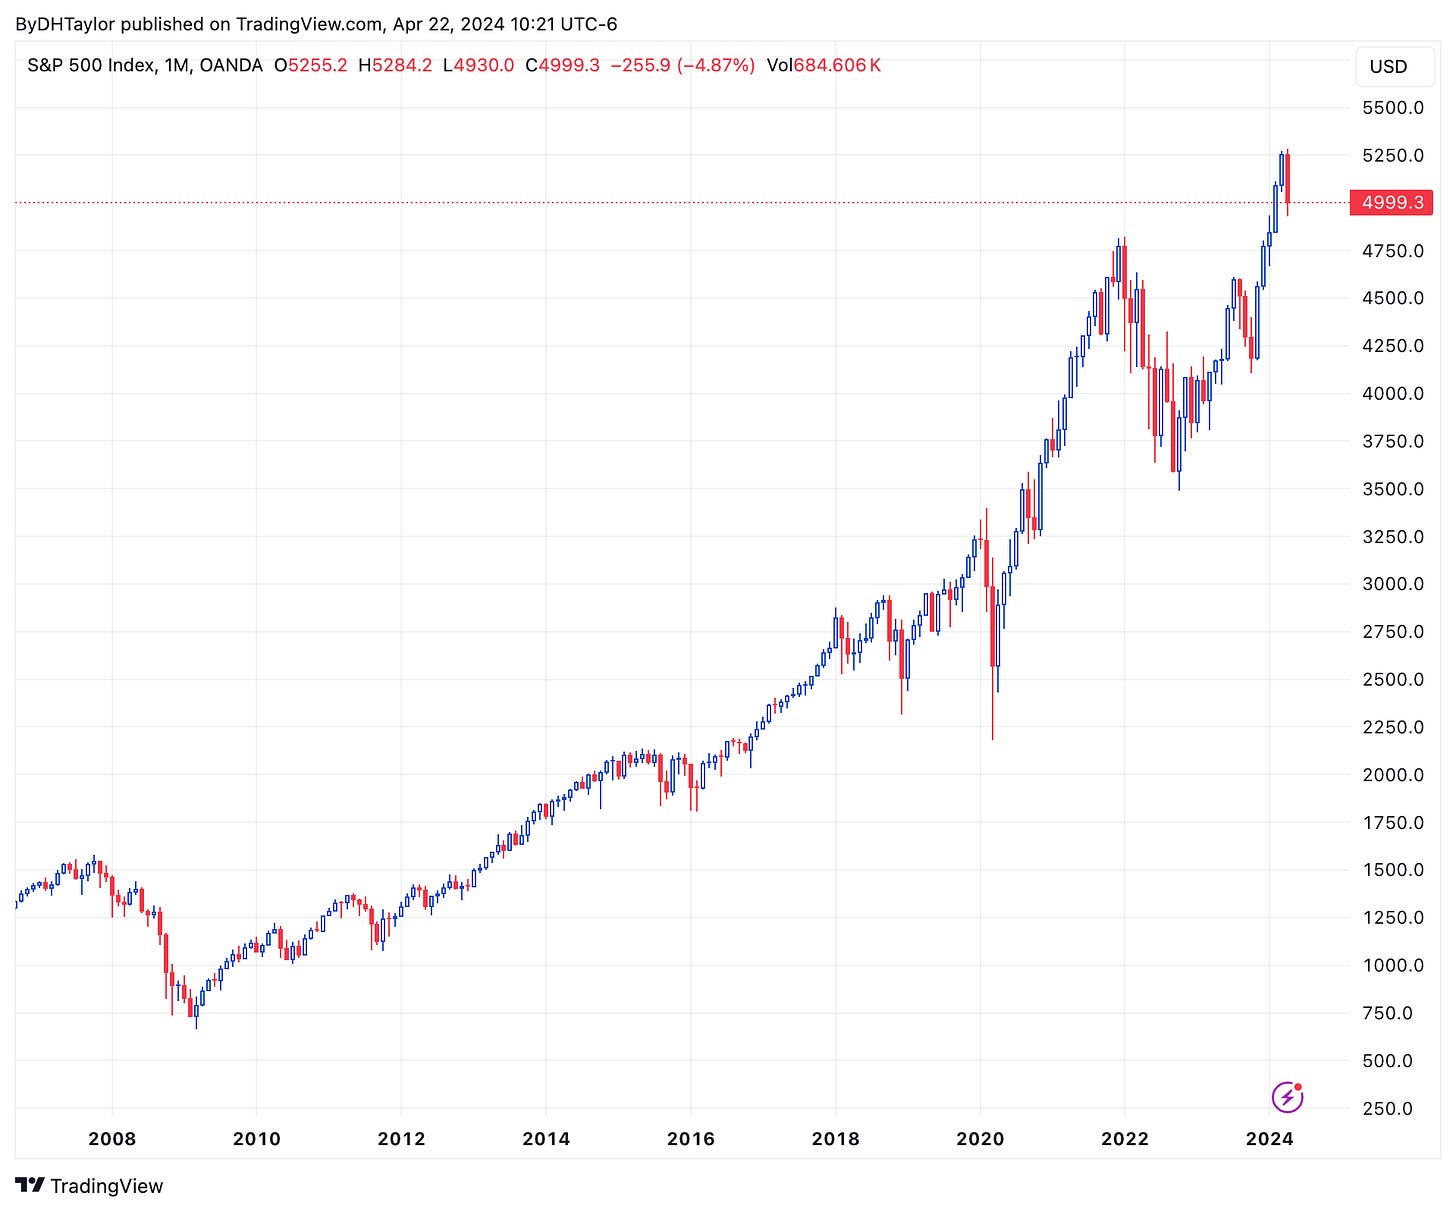
Looking at the most recent moves above in the stock market, the S&P 500 peaked at the absolute end of 2022. Persistent inflation showed up and the Federal Reserve leapt into action. the Fed pushed short-term interest rates from their lowest levels almost ever, to the highest levels in decades at blistering speed.
During this time, the stock market dropped nearly 30% in short time. But, the market felt the Fed would be able to lower rates to levels that would be less restrictive as inflation was tamed.
But, was inflation tamed?
Looking at the above charts, employment is at all-time highs. Incomes are growing and increasing. So, too, are expenditures and inflation pressures, while having dropped from very high levels have started to creep back upward.
To me, this is anything but a restrictive policy level. Plain and simple: If the economy is not contracting, then policy levels are not restrictive. And, while the Fed had hoped for a soft landing, they missed.
The Fed will have to raise rates and the stock market will need to adjust to this level of interest rates. That means the stock market may likely see a large selloff.
The Bond Market
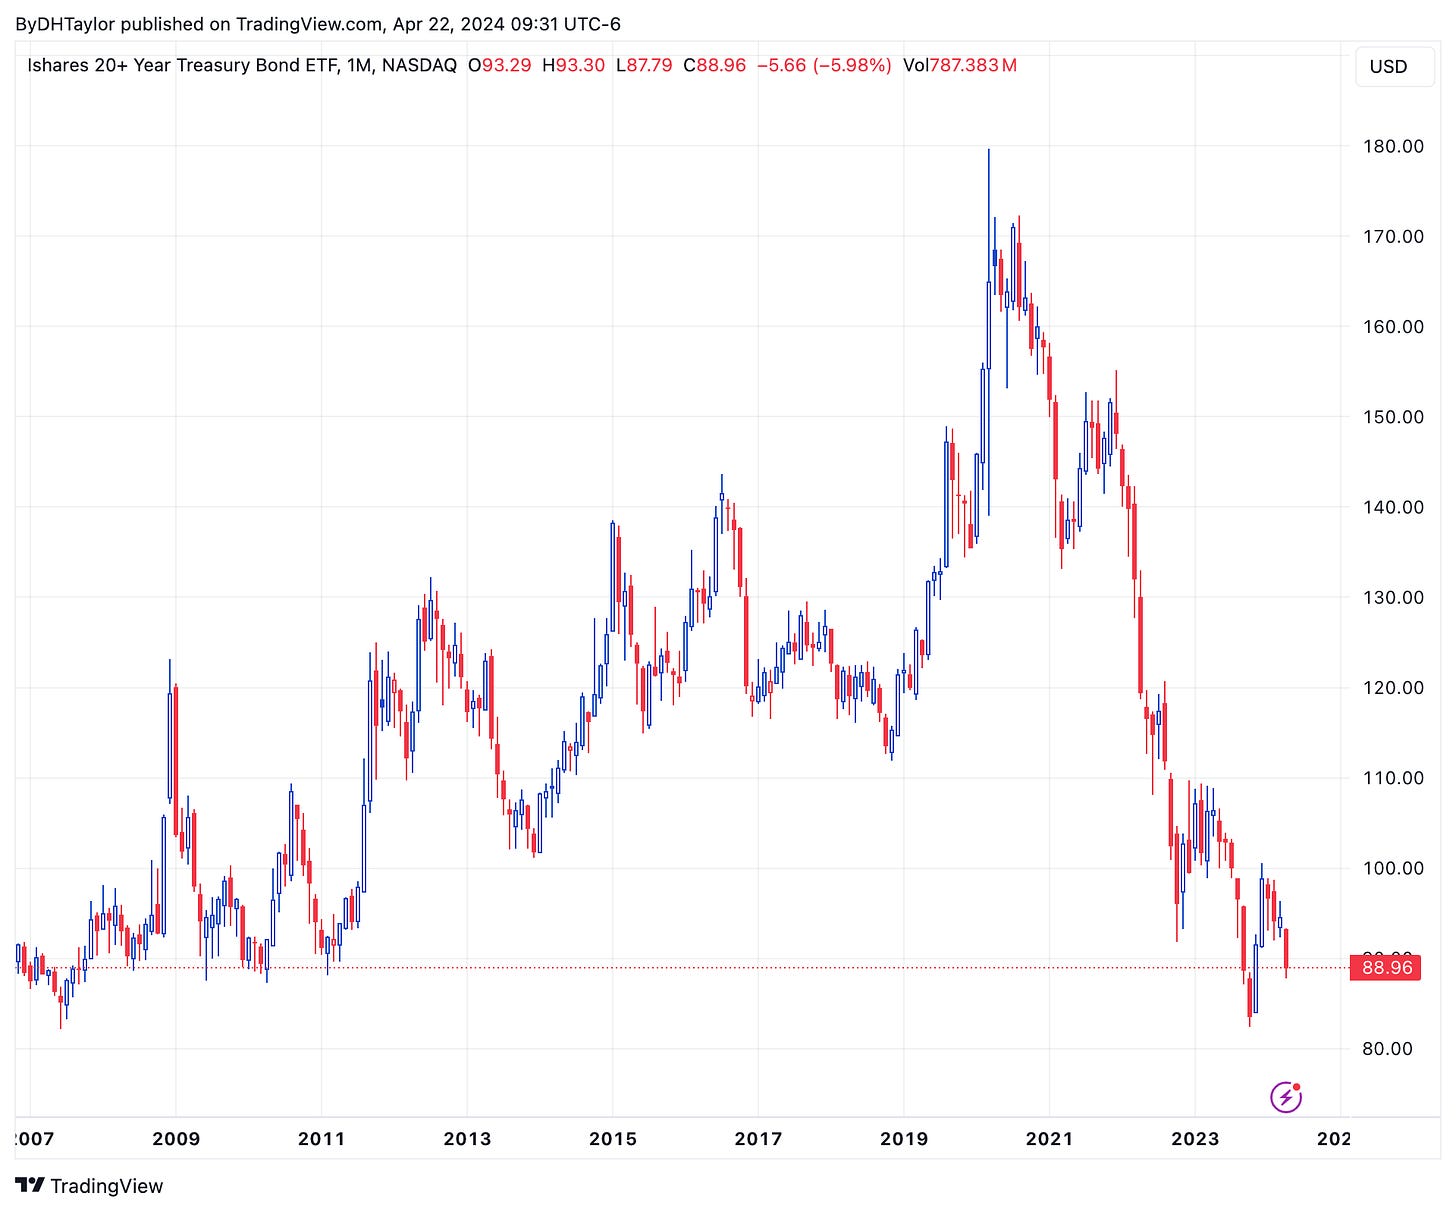
Above is TLT Stock - the Bond ETF. As bond yields rise, the inverse relationship between bond prices and yields drives TLT stock lower. As can be seen, the move lower in TLT stock has been pronounced during the period where the Fed has been raising interest rates. TLT stock has dropped from ~$170.00 to ~$82.50.
Where does TLT stock go from here?
The Fed’s goal is to contain inflation to the point where 2.00% year-over-year price increases is achieved. The Fed is likely to move interest rates higher, albeit they are nearly at a level that is restrictive enough to hit their target.
But, the economy needs to pause modestly in order for the Fed to achieve its inflation target goal. This means that the interest rate levels actually needs to get to a level that is restrictive. It is not.
But, once the economy is constricted enough to contain inflation, then the Fed would want to lower rates in order to get to the point where policy would then be accommodative to an economy that would need a modest amount of recovery.
My Take
The Fed missed. And, the stock market is wrong. I have been saying this for months. I have been front-running economic data on a regular basis and bringing in solid profits along the way. But, I have been taking my profits and running as fast as I could because the stock market is wrong and has no intention of stopping any time soon.
But, if continued economic data hits that shows inflation is not going to hit the Fed’s target rate, bond yields will climb. This will push equity investors to take profits. This could turn into a cascade of selling.
But, the eventuality is that the Fed will shift back to accommodative policy. That translates into the above chart - TLT stock - heading back upward. While it may be difficult to pick the absolute bottom in TLT stock - driven by the activity from the Fed which is being driven by inflation.
My bet is that TLT stock is about as close to its bottom as it needs to be. Maybe there is a bit more downside? Maybe a lot. Regardless, at some point there will be a longterm move right back upward.
In fact, if TLT stock is nowhere near its ultimate low, that means the Fed had to really ramp up interest rates in order to get to the level that would restrict inflation enough achieve their stated goal of 2.00% year-over-year price increases. If that were the case, if the Fed really, really had to raise. interest rates to a much more restrictive policy level, when they reversed their policy, they would do so at a very rapid pace.
TLT stock would very likely rise to about $100.00 at the very least and do so at a very rapid pace. And, it may be that TLT stock could push to $120.00 if the Fed did enough damage. At its current price of $88.50, that would be ~36.75% price increase.
The downside risk, as far as I can see, would only be time. It is only a matter of when the Fed moves to get to either neutral stance or accommodative. Therefore, it is only a matter of time before TLT stock rises back above $100.00. Yes, there may be more downside. But, when does the Fed shift, not if.
I’m going in on TLT stock and I am going to continually add to this position as it moves lower. My thinking is that we see TLT stock much higher by the end of this year versus any prolonged downside.


